
Introduction
There are seemingly innumerable battles quantitative traders fight to continue delivering superior returns. Two of the most impactful dimensions in quantitative trading are time and speed, the first derivative of key variables with respect to time. Careful consideration of these two dimensions, as well as how they interplay, can help produce more accurate estimates of the future behaviour of financial instruments.
In this short study, we use a simple alpha model to demonstrate the staggering cost of being slow to trade, whilst also putting it into the perspective of recent financial history.
Problem Statement
In quant trading, we rely on mathematical models, commonly called alphas, which are used to predict a component or a direction of future behaviour of financial securities of interest. Alphas are an important element in producing a forecast in price or returns, and one of the key components in making informed trading decisions to secure a profit. Being a key source of competitive advantage, the accuracy of estimating the magnitude of alphas in a particular direction is of utmost importance for systematic traders.
One interesting phenomenon, henceforth referred to as alpha decay, is the loss in predictive power of an alpha model over time. Alpha decay presents a serious challenge for systematic traders as it leads to poorly-informed trading decisions which can have a substantial financial cost.
Experimental Results
A motivating example for our investigation is a very simple alpha model based on a mean-reversion signal, similar to those used by many systematic traders. We express the alpha through the use of a simple closed-form solution to the mean-variance optimization problem done in a way to produce standardized results from a risk perspective and simulate the resulting strategy over 15 years of historical data on the US and European equities markets. For each region, we then perform a series of similar simulations of the lagged version of the signal whereby trading decisions are made using alpha predictions delayed by some time. Finally, we examine the average difference in annualized percentage returns between the original and lagged versions of the strategy. This helps us to measure the cost of alpha decay and delay in trading a given signal.
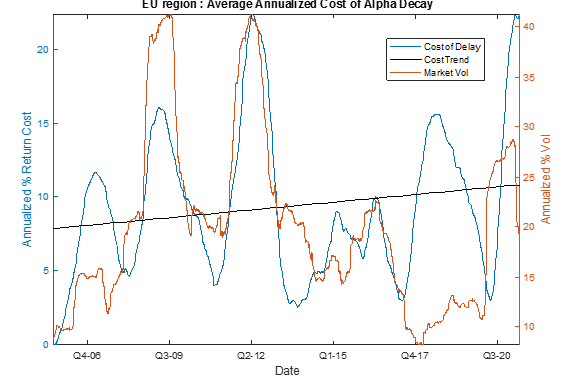
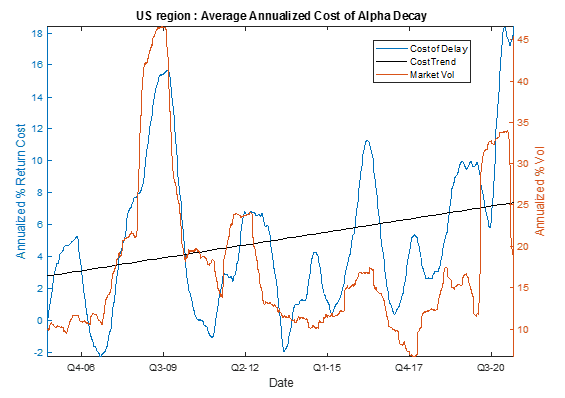
The graphs above show the average cost of alpha decay over time. On average, the cost amounts to 9.9% in Europe and 5.6% in the US, which is substantial enough to make many alphas unusable. As we can see, there is also a general upward trend in the cost of alpha decay. The annual rate of increase is on average 36bps in the US and 16bps in Europe which translates to a significant absolute cost for large portfolios.
As one would expect, there is a strong positive correlation between this cost and the volatility of the market ‒ at volatile times information tends to be priced into security prices faster, making it more costly to trade on stale signals.
Conclusion
Why is the cost of alpha decay increasing? We live in an age where information is disseminated at increasing speeds, to the extent asset prices are a reflection of information we should expect that asset prices will also reflect increased speed of information dissemination. There are several mechanisms in how this is reflected. Firstly, an alpha that works well tends to become more popular over time and therefore the competition for its profit increases. When an alpha becomes “crowded” the first few traders to act on it take most of its profit, leaving little to no edge to late arrivers. Secondly, recent years have seen a rapid improvement in trading technology and general computational power which has drastically increased the speed of trading and processing of new data, making trade timing more crucial than ever. Thirdly, the cost of trading has been steadily decreasing over the years which continues to lower the barrier for entry into systematic trading which bolstered the competition even more and has the compounding effect of making smaller opportunities more attractive to chase.
The aforementioned reasons contributing to the increasing cost of alpha decay present a challenge to every participant of the systematic trading industry. To remain competitive in the face of these factors we need to perpetually reinvent ourselves. On the one hand, with the profitability of any given alpha model waning over time, it is vital for us to keep improving our models and come up with new ones. To do this, we need to dedicate time and effort to research, whilst also challenging ourselves to stay curious and intellectually rigorous. The increasing importance of speed in capturing the profit of a given alpha ahead of the competition requires that we continue to invest in cutting-edge technology and market-leading trading infrastructure. All in all, the technical challenges we face are both complex and diverse, which makes Maven Securities, and the Systematic Alpha team, a fun and truly inspiring place to work.
We hope that this study provides some insight into what alpha decay is and what it means for systematic traders. If this article has sparked your interest and you’d be interested in discussing this topic or other aspects of working at Maven, please do get in touch: recruitment@mavensecurities.com